


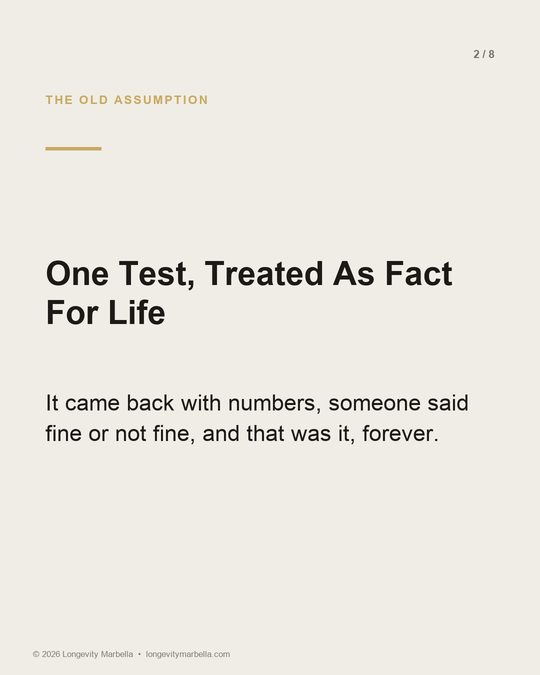
Most men who have ever had a semen analysis have had exactly one. It came back with numbers, somebody said fine or not fine, and that was treated as a permanent fact about the man.

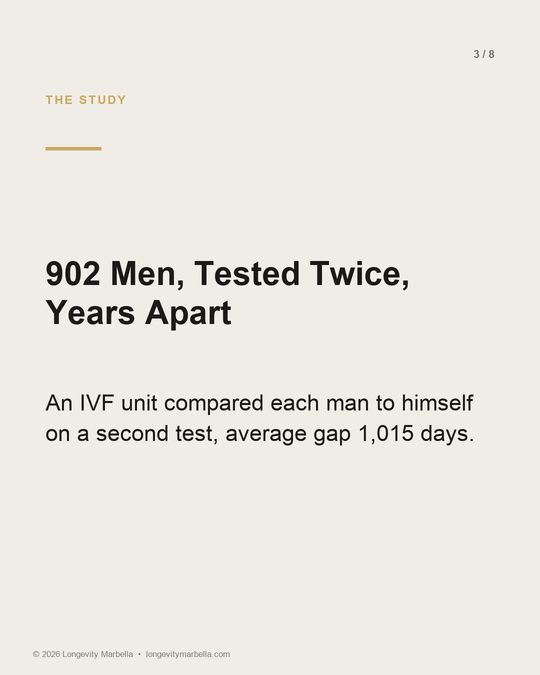
- 902 men with at least two semen analyses more than a year apart, average gap 1,015 days.
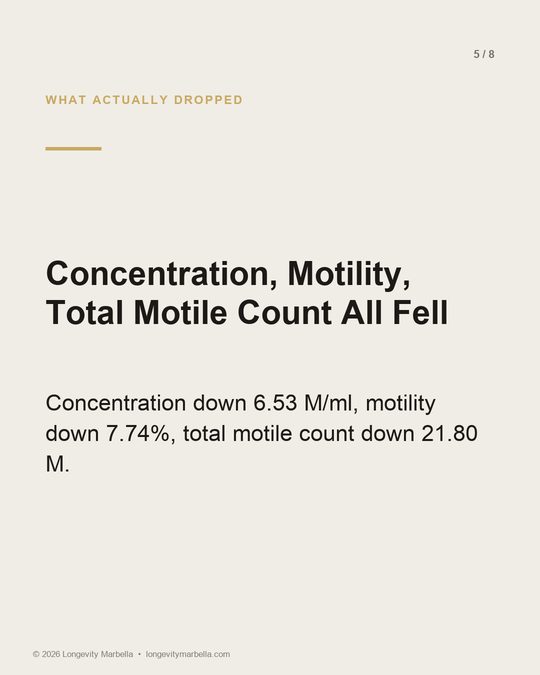
- Men with a normal baseline declined: concentration down 6.53 M/ml, motility down 7.74%, total motile count down 21.80 M.
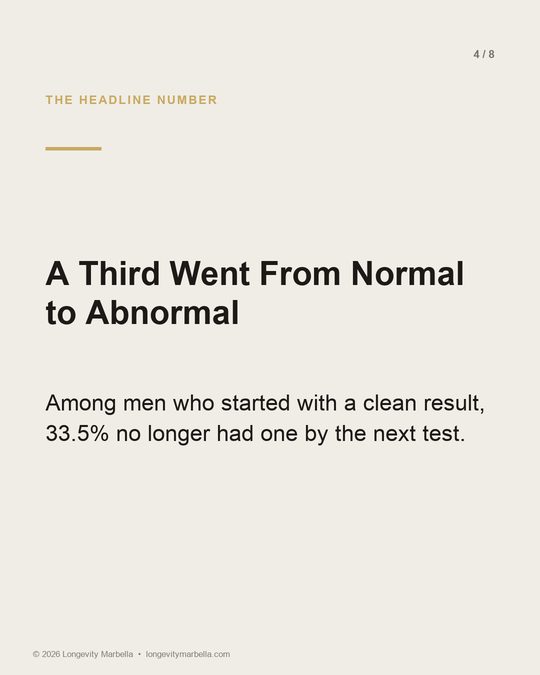
- 33.5% of men with a normal baseline had an abnormal parameter by the second test.
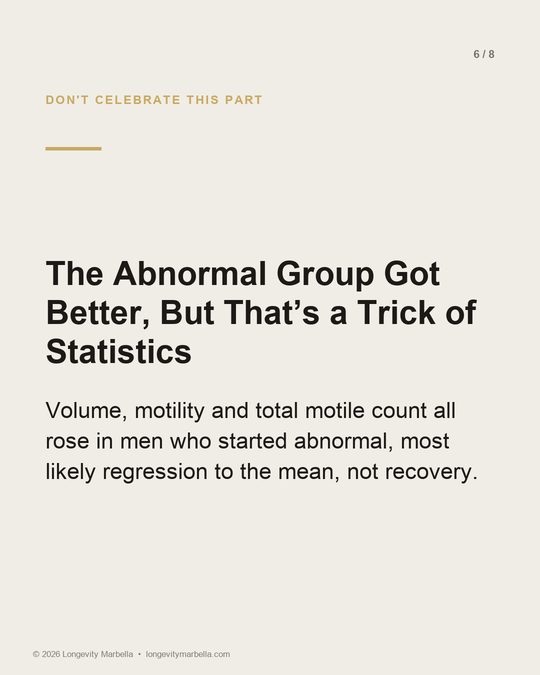
- Men with an abnormal baseline mostly improved, which is very likely regression to the mean rather than recovery.
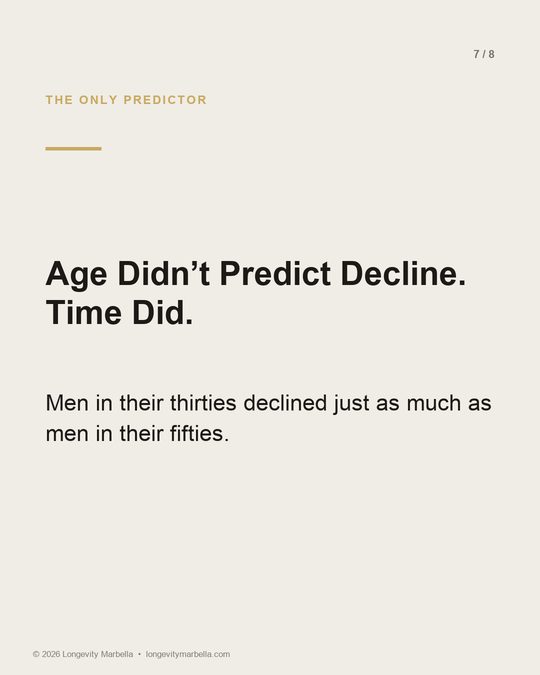
- The only independent predictor of decline was time between tests, and men in their thirties declined much like men in their fifties.
A 2024 study in Reproductive Sciences followed what happens when you test the same man twice, and the results argue that a single analysis tells you about a moment rather than about a person.
What they did
A university-affiliated IVF unit reviewed 902 men assessed for infertility who had at least two semen analyses performed more than a year apart, with the most recent falling between 2017 and 2021. The average gap between tests was 1,015 days, roughly two years and nine months, though the range ran from one year to more than twenty-one.
Then they did something most studies do not: instead of comparing groups of men, they compared each man to himself.
The men who started normal drifted down
Among men whose baseline analysis was normal, most parameters fell measurably by the second test: concentration down 6.53 million per millilitre, motility down 7.74%, and total motile count down 21.80 million. All statistically significant.
Total motile count is the number that matters most in practice, because it combines how many sperm there are with how many of them are actually swimming. Losing nearly 22 million of them is not a rounding error.
And the headline figure: 33.5% of the men who started with a completely normal analysis had developed an abnormality in at least one parameter by the second test, within a mean of 1,013 days.
The men who started abnormal drifted up
Here the study turns counterintuitive. Men whose baseline was abnormal mostly improved: volume up 0.21 ml, motility up 8.72%, total motile count up 14.38 million.
Before anyone celebrates, this pattern has a well-known statistical explanation called regression to the mean. Semen analysis is a famously variable test, and a man whose first result landed at the bottom of his own personal range is, by simple arithmetic, more likely to land higher next time regardless of anything he did. The same coin flips the other way for the men who started high.
That does not make the finding useless. It makes it a warning: one bad result is not a sentence, and one good result is not a guarantee. Both need repeating before anybody builds a plan on them.
The only thing that independently predicted decline
The researchers hunted for risk factors that would explain who deteriorated. What survived the analysis was almost embarrassingly plain: the length of time between the two tests. Nothing else emerged as an independent prognostic factor.
And a detail that deserves its own sentence: the deterioration was similar in men in their thirties, forties and fifties. The men in their thirties were not spared.
What total motile count actually is
Three numbers get quoted from a semen analysis and they are not equally useful. Concentration is how many sperm sit in each millilitre. Motility is what percentage of them are moving. Total motile count multiplies concentration by volume by motility, which is why it is the closest single figure to "how many functional sperm actually left the building".
It is also the number that moved most in this study, down 21.80 million in the men who started normal and up 14.38 million in the men who started abnormal. Concentration is units per crate, volume is how many crates went out, motility the share that still work on arrival. A factory can hold units per crate steady while the shipment that works shrinks, which is how a man's total motile count slides while his concentration looks unchanged, and one reason a single quoted number reassures more than it should.
The range hidden inside the average
The average gap between tests was 1,015 days, but the range ran from 366 days to 7,709 days. That upper figure is over twenty-one years: men whose fertility was being assessed against a result from another era of their life.
It is worth sitting with that. Some of the men in this dataset had their reproductive capacity discussed on the basis of a document older than a school-age child, and the study's central finding is that time is precisely the variable that predicts the document being wrong.
What this does not prove
These were men attending an IVF clinic, not a random sample of the population, so they are not a perfect mirror of every man on the coast. It is retrospective. And as above, the improvement seen in the abnormal group is very likely a statistical artefact rather than spontaneous healing.
What it establishes cleanly is the variability itself, measured inside individual men rather than across populations, which is the part almost nobody quantifies.
What "abnormal in one or more parameters" actually changes
A third of the normal-baseline men crossed into abnormality, and it is worth being precise about what that threshold means, because it is not a cliff.
Crossing it means at least one measured value fell below the reference range. It does not mean conception became impossible, and it does not mean anything irreversible happened. What it changes is the conversation: a couple planning around a normal result and a couple planning around an abnormal one make different decisions about timing, about investigation, and about how long to keep waiting before asking for help.
That is why an out-of-date result is not a neutral thing to carry. It is not merely imprecise; it can be actively steering decisions in the wrong direction, and the man holding it has no way of knowing.
Why a repeat test is not simply the same test again
There is a common assumption that repeating a semen analysis is a formality, a second opinion on a fact already established. This dataset argues the opposite: the second test is a different piece of information, because it carries something the first cannot, which is direction.
A count of 40 million means one thing if the previous reading was 25 million and something quite different if it was 70 million. The absolute figure is identical; the situation is not. Only the pair tells you whether a man is drifting, holding, or recovering, and drift is the thing worth catching early because it is the thing still open to influence.
Who these men were, and who they were not
These were men attending an IVF unit as part of a couple's infertility assessment. That has two consequences worth stating.
The first is that they are enriched for problems compared with men walking down the street, so the absolute rates here should not be read as population figures. The second, less obvious, is that they were being tested for a reason and were therefore likely to be more attentive to their health than average, not less. Whatever drove the decline in the normal-baseline group, it was not happening to a uniquely careless population.
The practical consequence
If you were tested once, years ago, and told it was fine, this study says that result has a shelf life. A third of the men in exactly that position were no longer fine by the next test, and the strongest thing predicting it was simply the passage of time.
The useful unit is not a number, it is a trajectory. One analysis tells you where you stand today, which is worth knowing. Two, spaced sensibly and performed to the same standard, tell you which direction you are travelling, which is worth considerably more, because direction is the thing you can still change.
Frequently Asked Questions
How often should a semen analysis be repeated?
There is no single interval that suits everyone, and this study does not set one. What it shows is that a result more than a couple of years old has meaningfully less predictive value than a recent one, and that time itself was the only independent predictor of change.
Why did the men with abnormal results improve?
Most probably regression to the mean. Semen analysis varies a great deal within the same man from week to week, so a result at the bottom of someone's personal range tends to be followed by a higher one. That is a statistical effect, not a treatment effect.
Does this mean sperm quality falls in your thirties?
In this cohort the rate of deterioration among men with a normal baseline was similar across the third, fourth and fifth decades, which surprised the authors too. It argues against the comfortable assumption that decline only becomes relevant later.
Is one abnormal result enough to diagnose a problem?
No, and this study is a good argument for why not. Given the variability shown here, a single result at either end deserves confirmation before it becomes the basis of a plan.
This article is for general information only and is not medical advice. Fertility and hormone treatments should be guided by a qualified doctor based on your own assessment.
Reference. Cohen N, Ben-Meir A, Harlap T, Imbar T, Karavani G. "Changes in Sperm Parameters with Time in Men with Normal and Abnormal Baseline Semen Analysis." Reproductive Sciences 2024;31:1712-1718 (doi:10.1007/s43032-024-01475-1).
Ready to see your direction, not just a number?
Speak with a double board-certified specialist about proper fertility and hormonal assessment, repeated to the same standard so the trend means something, by secure video or at your residence across the Costa del Sol.
A letter from the doctor. A few times a year, when the evidence genuinely changes, I write it down and send it. No schedule, no noise, and you can leave the list whenever you like.