


A large American dataset appears to show that adults in the top quarter for testosterone have half the arthritis of those in the bottom quarter. It is exactly the number a hormone clinic would put on a billboard. We are going to show you why it does not survive the rest of the paper, and why that matters more than the finding itself.
Not sure if this applies to you? One-minute check.
- Cross-sectional data on 10,439 adults, 26.97 percent reporting arthritis. Self-reported, both ways.
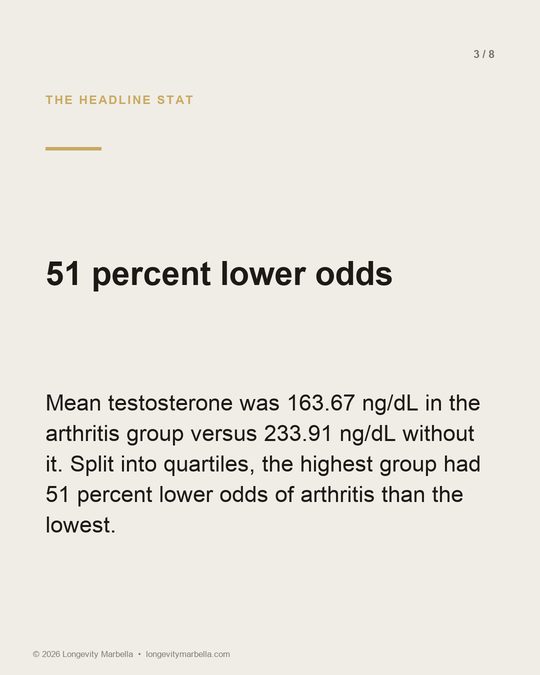
- The crude picture looks convincing: 163.67 ng/dL mean testosterone with arthritis against 233.91 without, and 51 percent lower odds in the top quartile.
- Fully adjusted, the odds ratio is 1.02 with a confidence interval of 0.97 to 1.07. Nothing left.
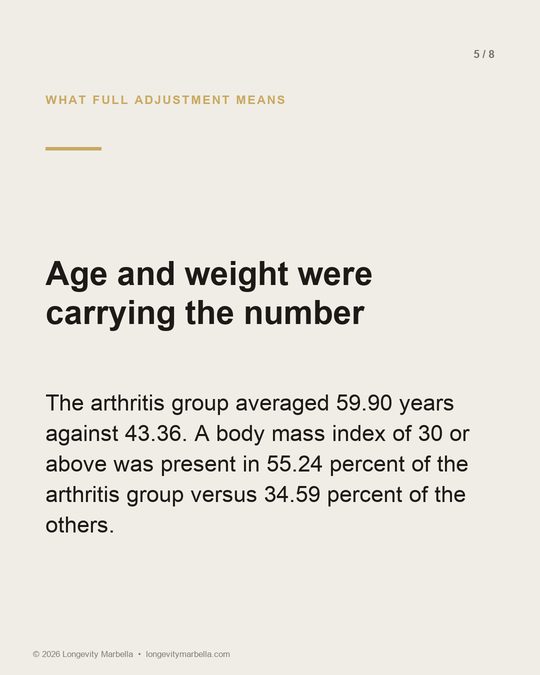
- The arthritis group averaged 59.90 years against 43.36. Age, not testosterone, was carrying the number.
What Was Actually Measured
This is a cross-sectional analysis of the National Health and Nutrition Examination Survey, or NHANES, covering 2013 to 2016. NHANES combines a household interview with a physical examination and laboratory testing, sampled to represent the United States population rather than one clinic's patients. Cross-sectional means everything was measured once, on the same day, in the same people. No follow-up, no before and after.
From 20,146 eligible individuals the authors removed 5,380 with no testosterone value and 4,327 with no arthritis data, leaving 10,439 adults, mainly aged 20 and over. Of those, 48.11 percent were men, mean age was 47.25 years with a standard deviation of 16.80, and mean serum testosterone was 214.97 ng/dL with a standard deviation of 234.70. 26.97 percent reported arthritis: 2,734 people with it, 7,705 without.
Testosterone was measured by isotope dilution liquid chromatography tandem mass spectrometry, the reference method, and that is a real strength. Arthritis was self-reported, established by asking whether a doctor or other health professional had ever told them they had it. The authors cite earlier work reporting 81 percent agreement between self-reported and clinically confirmed osteoarthritis. Among those who said yes, 52.00 percent called it osteoarthritis or degenerative arthritis and 14.34 percent rheumatoid.
The Crude Picture, Which Looks Convincing
On the surface the association is strong and tidy. Mean testosterone in the arthritis group was 163.67 ng/dL against 233.91 ng/dL in the group without arthritis, with a p value below 0.0001.
The authors then split testosterone into quartiles, four equal groups from lowest to highest. In their fully adjusted model, with the lowest quartile as reference, the odds ratios ran 1.00, 0.85, 0.53 and 0.49. That last figure is the headline: the highest quartile had 51 percent lower odds of arthritis than the lowest. An odds ratio is the odds in one group divided by the odds in another, so below 1.00 means less, above means more, and 0.49 reads as roughly half.
Now the Number That Never Gets Quoted
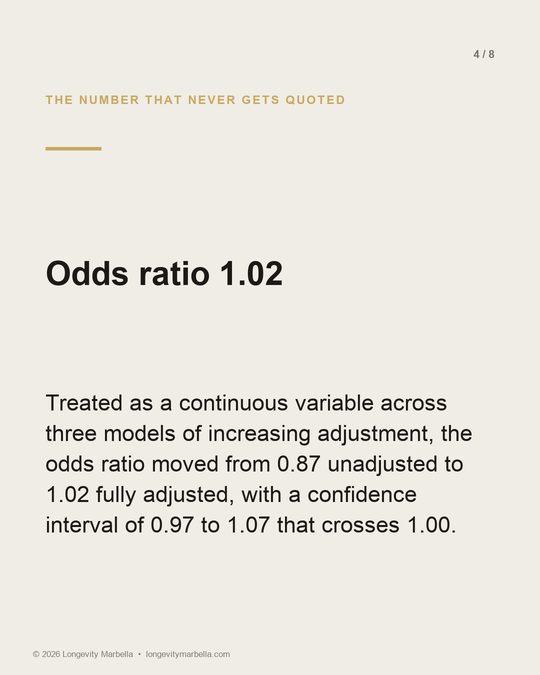
The same table in the same paper also reports testosterone as a continuous variable, per 100 ng/dL, across three models of increasing adjustment.
- Model 1, no adjustment at all: odds ratio 0.87, 95 percent confidence interval 0.85 to 0.89.
- Model 2, adjusted for age, sex and race: 0.93, confidence interval 0.90 to 0.97.
- Model 3, fully adjusted: 1.02, confidence interval 0.97 to 1.07.
A 95 percent confidence interval is the range of values compatible with the data, the span a gauge needle could rest in. On that gauge, 1.00 is the mark for no effect, and 0.97 to 1.07 sits on both sides of it. The honest reading is that no association was demonstrated. Not a weak one. None.
An odds ratio of 1.02 with a confidence interval from 0.97 to 1.07 is not a small effect. It is no effect.
Watch the sequence. Unadjusted, each 100 ng/dL of testosterone carried an odds ratio of 0.87. Adjust for age, sex and race alone and most of it has gone. Adjust for everything and it is gone entirely.
What Full Adjustment Actually Means
Model 3 accounted for age, sex, race, education level, marital status, body mass index, alcohol status, smoking status, hypertension, diabetes, cardiovascular disease, estradiol, sex hormone binding globulin and the income to poverty ratio.
Adjustment is not a trick. It asks a plain question: comparing people alike in age, sex, weight and the rest, does testosterone still tell you anything about their joints? Here the answer is no, and the baseline table shows why.
- Mean age was 59.90 years in the arthritis group against 43.36 years in the group without it.
- A body mass index of 30 or above: 55.24 percent of the arthritis group, 34.59 percent of the others.
- Hypertension 55.57 against 25.58 percent, diabetes 18.24 against 7.78 percent, cardiovascular disease 18.56 against 5.01 percent.
- Women were 61.69 percent of the arthritis group and 48.27 percent of the group without.
Older people have more arthritis and lower testosterone. Heavier people have more arthritis and lower testosterone. Women here had far more arthritis and, for ordinary physiological reasons, much lower testosterone. The crude association was carrying all of that on its back.
Why the Quartiles Still Look Significant
Two numbers from the same fully adjusted model point in opposite directions, and that deserves an explanation rather than a choice between them.
The quartile result does survive adjustment: Q3 at 0.53, confidence interval 0.35 to 0.79, and Q4 at 0.49, confidence interval 0.31 to 0.76. But those intervals are wide, meaning the data are compatible with anything from a very large effect to a modest one. And the p value for trend, below 0.0001 before adjustment, fell to 0.0327 after it, sitting just inside the conventional threshold rather than near it.
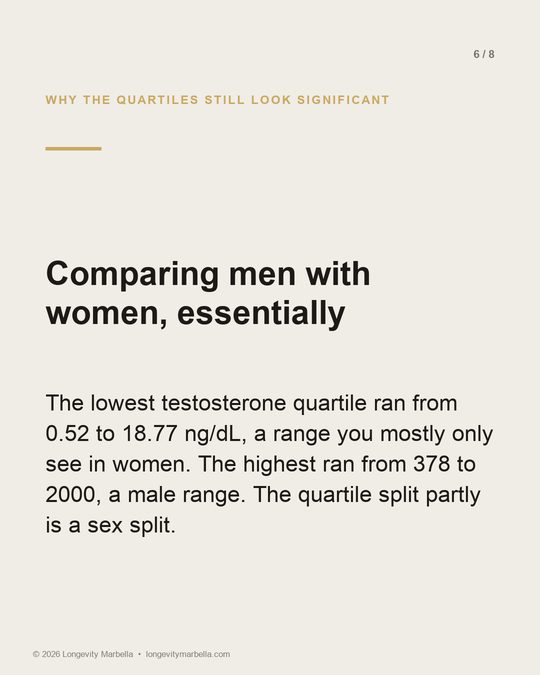
Then read the quartile boundaries, which the paper prints and the discussion does not dwell on. The lowest quartile runs from 0.52 to 18.77 ng/dL. The highest runs from 378 to 2000 ng/dL. A ceiling of 18.77 ng/dL is a concentration you essentially only see in women. A floor of 378 is a male one. Comparing the top quartile with the bottom is, to a large extent, comparing men with women, even though the model does adjust for sex.
The overall mean makes the same point arithmetically: 214.97 ng/dL with a standard deviation of 234.70, the spread of the readings. A spread larger than the average is what you get when one gauge averages two different machines. You are not looking at one population. You are looking at two, pooled.
One last point, since we would want to be told it ourselves. The paper's abstract and discussion state that the association held after adjustment. Its own Table 2 shows the continuous estimate did not. We have reported the table.
Where the Association Was Strongest: Women and Obesity
The subgroup analysis ought to give any testosterone clinic pause. The negative association was more significant in women and in people with a body mass index of 30 kg/m2 or above, and the interaction tests for sex and for that BMI category were statistically significant. Age, hypertension and diabetes showed no significant interaction, with p values above 0.05.
So the strongest signal in a study about testosterone and joints sat in women and in people with obesity, close to the opposite of the marketing use this paper will be put to. It is also where confounding is worst. The authors note the observational evidence that obesity is associated with low testosterone and that the relationship may run in both directions. There, a hormone level and a joint problem can share a cause without either one touching the other.
The Word Risk Is Doing Work It Cannot Do
The paper describes a reduced risk of developing arthritis. A cross-sectional study cannot measure development. Blood was drawn and the arthritis question answered on the same day, so nobody knows which came first, and the authors state it plainly: because of the design, no causal relationship could be obtained.
The reverse explanation fits just as well. Painful joints reduce activity, reduced activity costs muscle and adds fat, and persistent pain disturbs sleep. Arthritis lowering testosterone is as consistent with this dataset as low testosterone causing arthritis, and a snapshot cannot separate the two.
The authors list their limitations honestly: arthritis was established by interview, so recall bias was inevitable; the findings may not transfer to other populations; and residual confounding, unmeasured confounding and measurement error may all bias the analysis. Add the 5,380 and 4,327 individuals dropped from the 20,146 eligible, close to half the starting sample, with no multiple imputation, which they acknowledge may affect accuracy.
What to Do With This If Your Joints Hurt
This is one of the strongest recent datasets on the question, and it does not support offering a hormone for a joint problem. This is one of the strongest recent datasets on the question and it does not support the offer. No trial, no treatment, no before and after, and the fully adjusted continuous estimate says testosterone did not explain arthritis on its own.
That does not make the paper useless. It makes it an excellent lesson in how to read one. A headline percentage tells you what a comparison looked like. A fully adjusted model tells you whether the comparison meant anything. When the two disagree, the second one wins.
What is worth doing is separating the two questions instead of merging them. Joint pain deserves a proper mechanical and rheumatological assessment. Genuine symptoms of low testosterone deserve their own, which means more than one morning measurement and the surrounding pituitary and binding protein picture rather than a single figure. We set out what that involves in how low testosterone is diagnosed and monitored and in what a proper men's health blood panel measures.
The one modifiable factor in both halves of this study is body weight, and the authors make the point themselves: weight reduction through physical exercise and controlled diet may have a role in relieving osteoarthritis symptoms. That requires no hormone. If you would like your own results read in full context rather than as a single number, our specialist consults by video and at a private partner clinic on Avenida Ricardo Soriano, Marbella.
Does low testosterone cause arthritis?
This study cannot answer that, and its own fully adjusted analysis points towards no. With testosterone treated as a continuous variable, the odds ratio was 1.02 with a confidence interval of 0.97 to 1.07 once age, sex, body mass index and the rest of the covariate list were accounted for, which is a null result. The design is cross-sectional, so it could not establish which came first in any case.
Was the 51 percent figure wrong, then?
Not wrong, but incomplete on its own. In the fully adjusted quartile analysis the highest testosterone quartile did have 51 percent lower odds of arthritis than the lowest, odds ratio 0.49 with a confidence interval of 0.31 to 0.76. But the same fully adjusted model, using testosterone as a continuous measure, found nothing, and the p value for trend weakened from below 0.0001 to 0.0327. When a categorical result and a continuous result from one model disagree, that is a reason for caution rather than a headline.
Can testosterone therapy treat my joint pain?
This paper gives no support for that. It is an observational snapshot with no treatment, no randomization and no follow-up. Testosterone is considered for a properly diagnosed deficiency after full assessment, not for a joint complaint, and any clinic offering it for arthritis is going well beyond the evidence.
Why was the association stronger in women?
The subgroup analysis found the negative association between testosterone and arthritis was more significant in women and in people with a body mass index of 30 or above, with statistically significant interaction tests for both. Arthritis was far more common among women here, 61.69 percent of the arthritis group were female, and women have much lower testosterone for ordinary physiological reasons. The two travel together without one necessarily causing the other.
What should I ask my doctor about a study like this?
Ask which model a quoted figure comes from and what it was adjusted for. Ask whether people were followed over time or measured all at once. And for your own case, ask that the joint problem and the hormone question be assessed separately and properly, rather than having one offered to you as the answer to the other.
This article is for general information only and is not medical advice. Individual dietary and medical decisions should be discussed with a qualified doctor.
Reference. Cheng L, Wang S. "Lower serum testosterone is associated with increased likelihood of arthritis." Scientific Reports 2023;13:19241 (doi:10.1038/s41598-023-46424-1).
One number is rarely the whole answer
If your hormone results have been read to you as a single figure, our specialist can interpret the full picture alongside your symptoms, on a private video call or a concierge home visit across the Costa del Sol.
A letter from the doctor. A few times a year, when the evidence genuinely changes, I write it down and send it. No schedule, no noise, and you can leave the list whenever you like.